Website monitoring that never sleeps
Monitor your websites, SSL certificates, and domains from multiple regions worldwide. Get instant alerts before your customers notice any issues.
Everything you need to stay online
Comprehensive monitoring for your entire web infrastructure
HTTP Monitoring
Monitor website availability with customizable checks. Support for all HTTP methods, custom headers, and status code validation.
- GET, POST, PUT, DELETE support
- Custom timeouts & retries
- Follow redirects option
SSL Certificate Monitoring
Never let your SSL certificates expire. Get alerts before expiration and track certificate details automatically.
- Expiration tracking
- Certificate chain validation
- RSA & ECDSA support
Domain Expiry Tracking
Track domain registration expiry via WHOIS. Get notified before your domains expire and lose your online presence.
- 20+ TLD support
- WHOIS data extraction
- Days-until-expiry alerts
Ping Monitoring
Monitor host availability with ICMP ping checks. Verify network connectivity and measure round-trip latency to any server or device.
- ICMP echo request checks
- Round-trip time tracking
- Packet loss detection
Port Monitoring
Monitor TCP and UDP port availability. Ensure your services are listening and accepting connections on the expected ports.
- TCP & UDP port checks
- Database & cache monitoring
- Connection time tracking
Heartbeat Monitoring
Monitor your cron jobs, scheduled tasks, and background processes. Get alerted when jobs fail to run or take too long.
- Simple & start/complete modes
- Grace periods & hung job detection
- Simple ping URL integration
Multi-Region Monitoring
Monitor from multiple locations worldwide to ensure your site is accessible everywhere, not just from one region.
- Global monitoring locations
- Regional latency tracking
- Distributed architecture
Incident Management
Real-time incident tracking and resolution. See exactly when issues occurred and how long they lasted.
- Live incident feed
- Downtime duration tracking
- Historical incident data
Instant Notifications
Get alerted instantly when something goes wrong. Connect your favorite notification channels and never miss an incident.
- 10+ notification channels
- Per-monitor configuration
- Snooze from notifications
Notify your team where they work
Connect Updog to your favorite tools and get alerted instantly when something goes wrong
Slack
Team messaging
Discord
Community chat
Teams
Enterprise chat
Telegram
Secure messaging
Classic alerts
SMS
Text alerts
Push
Browser & mobile
PagerDuty
Incident mgmt
Webhooks
Custom integrations
More coming
Request an integration
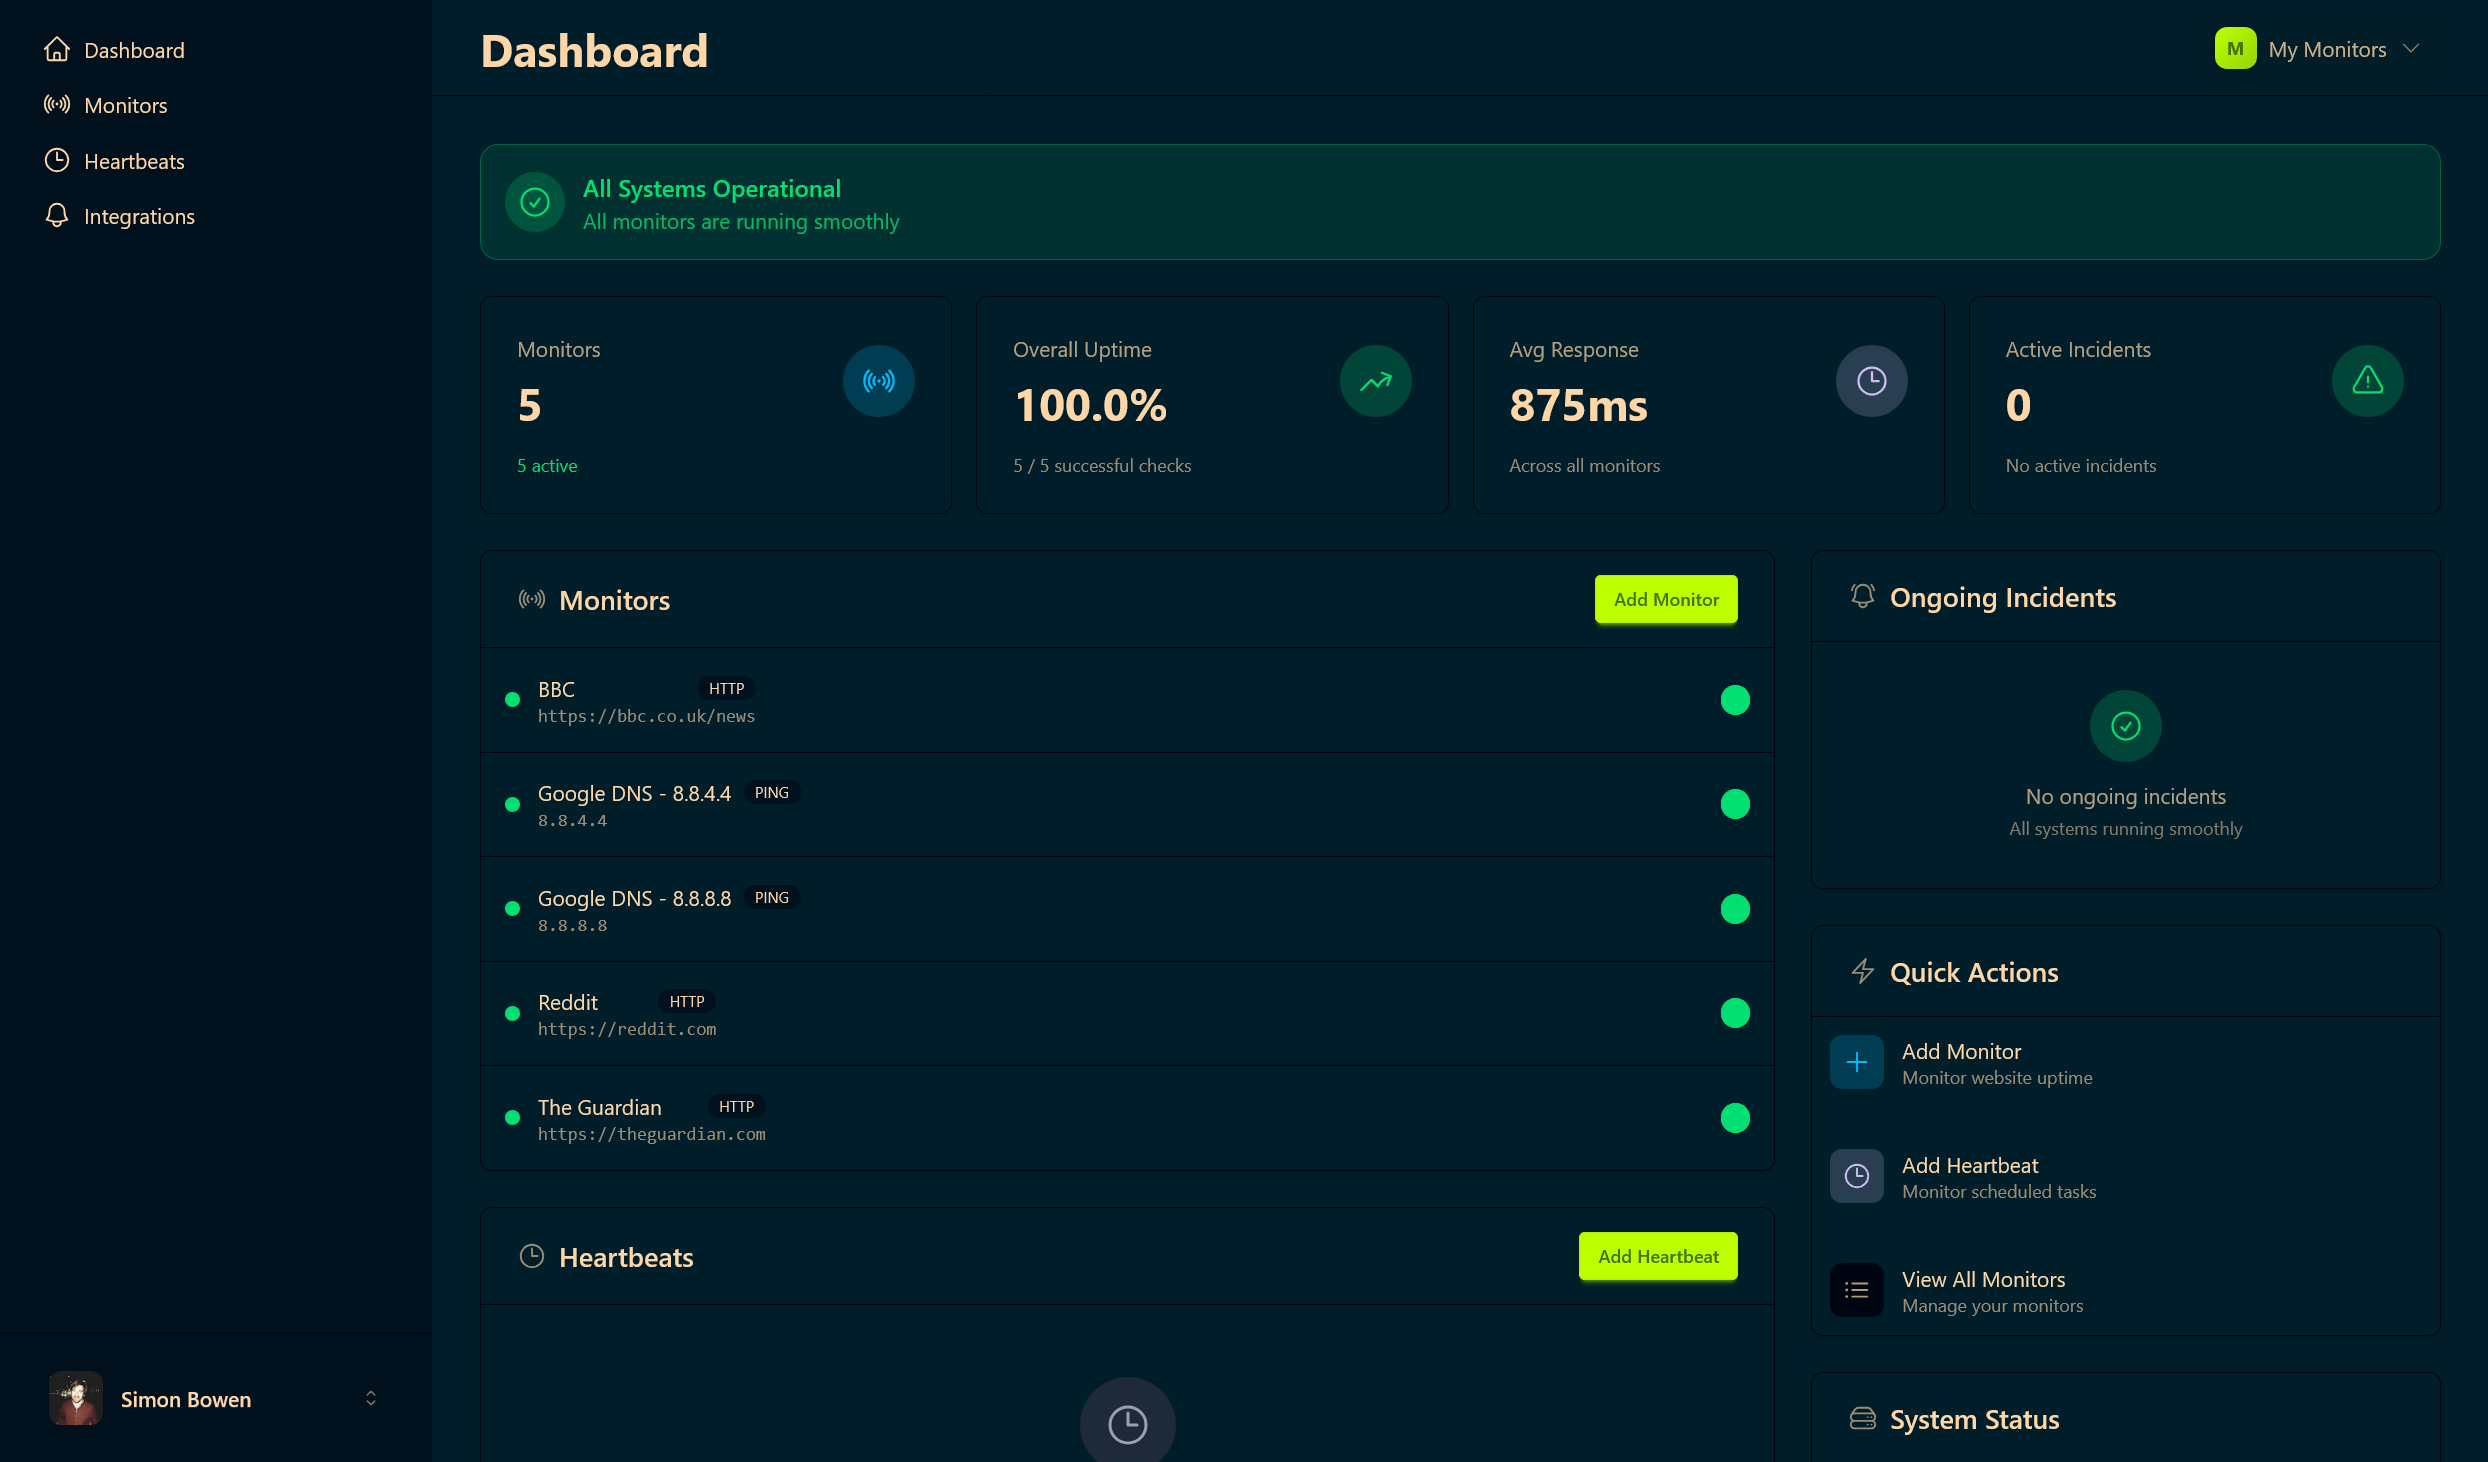
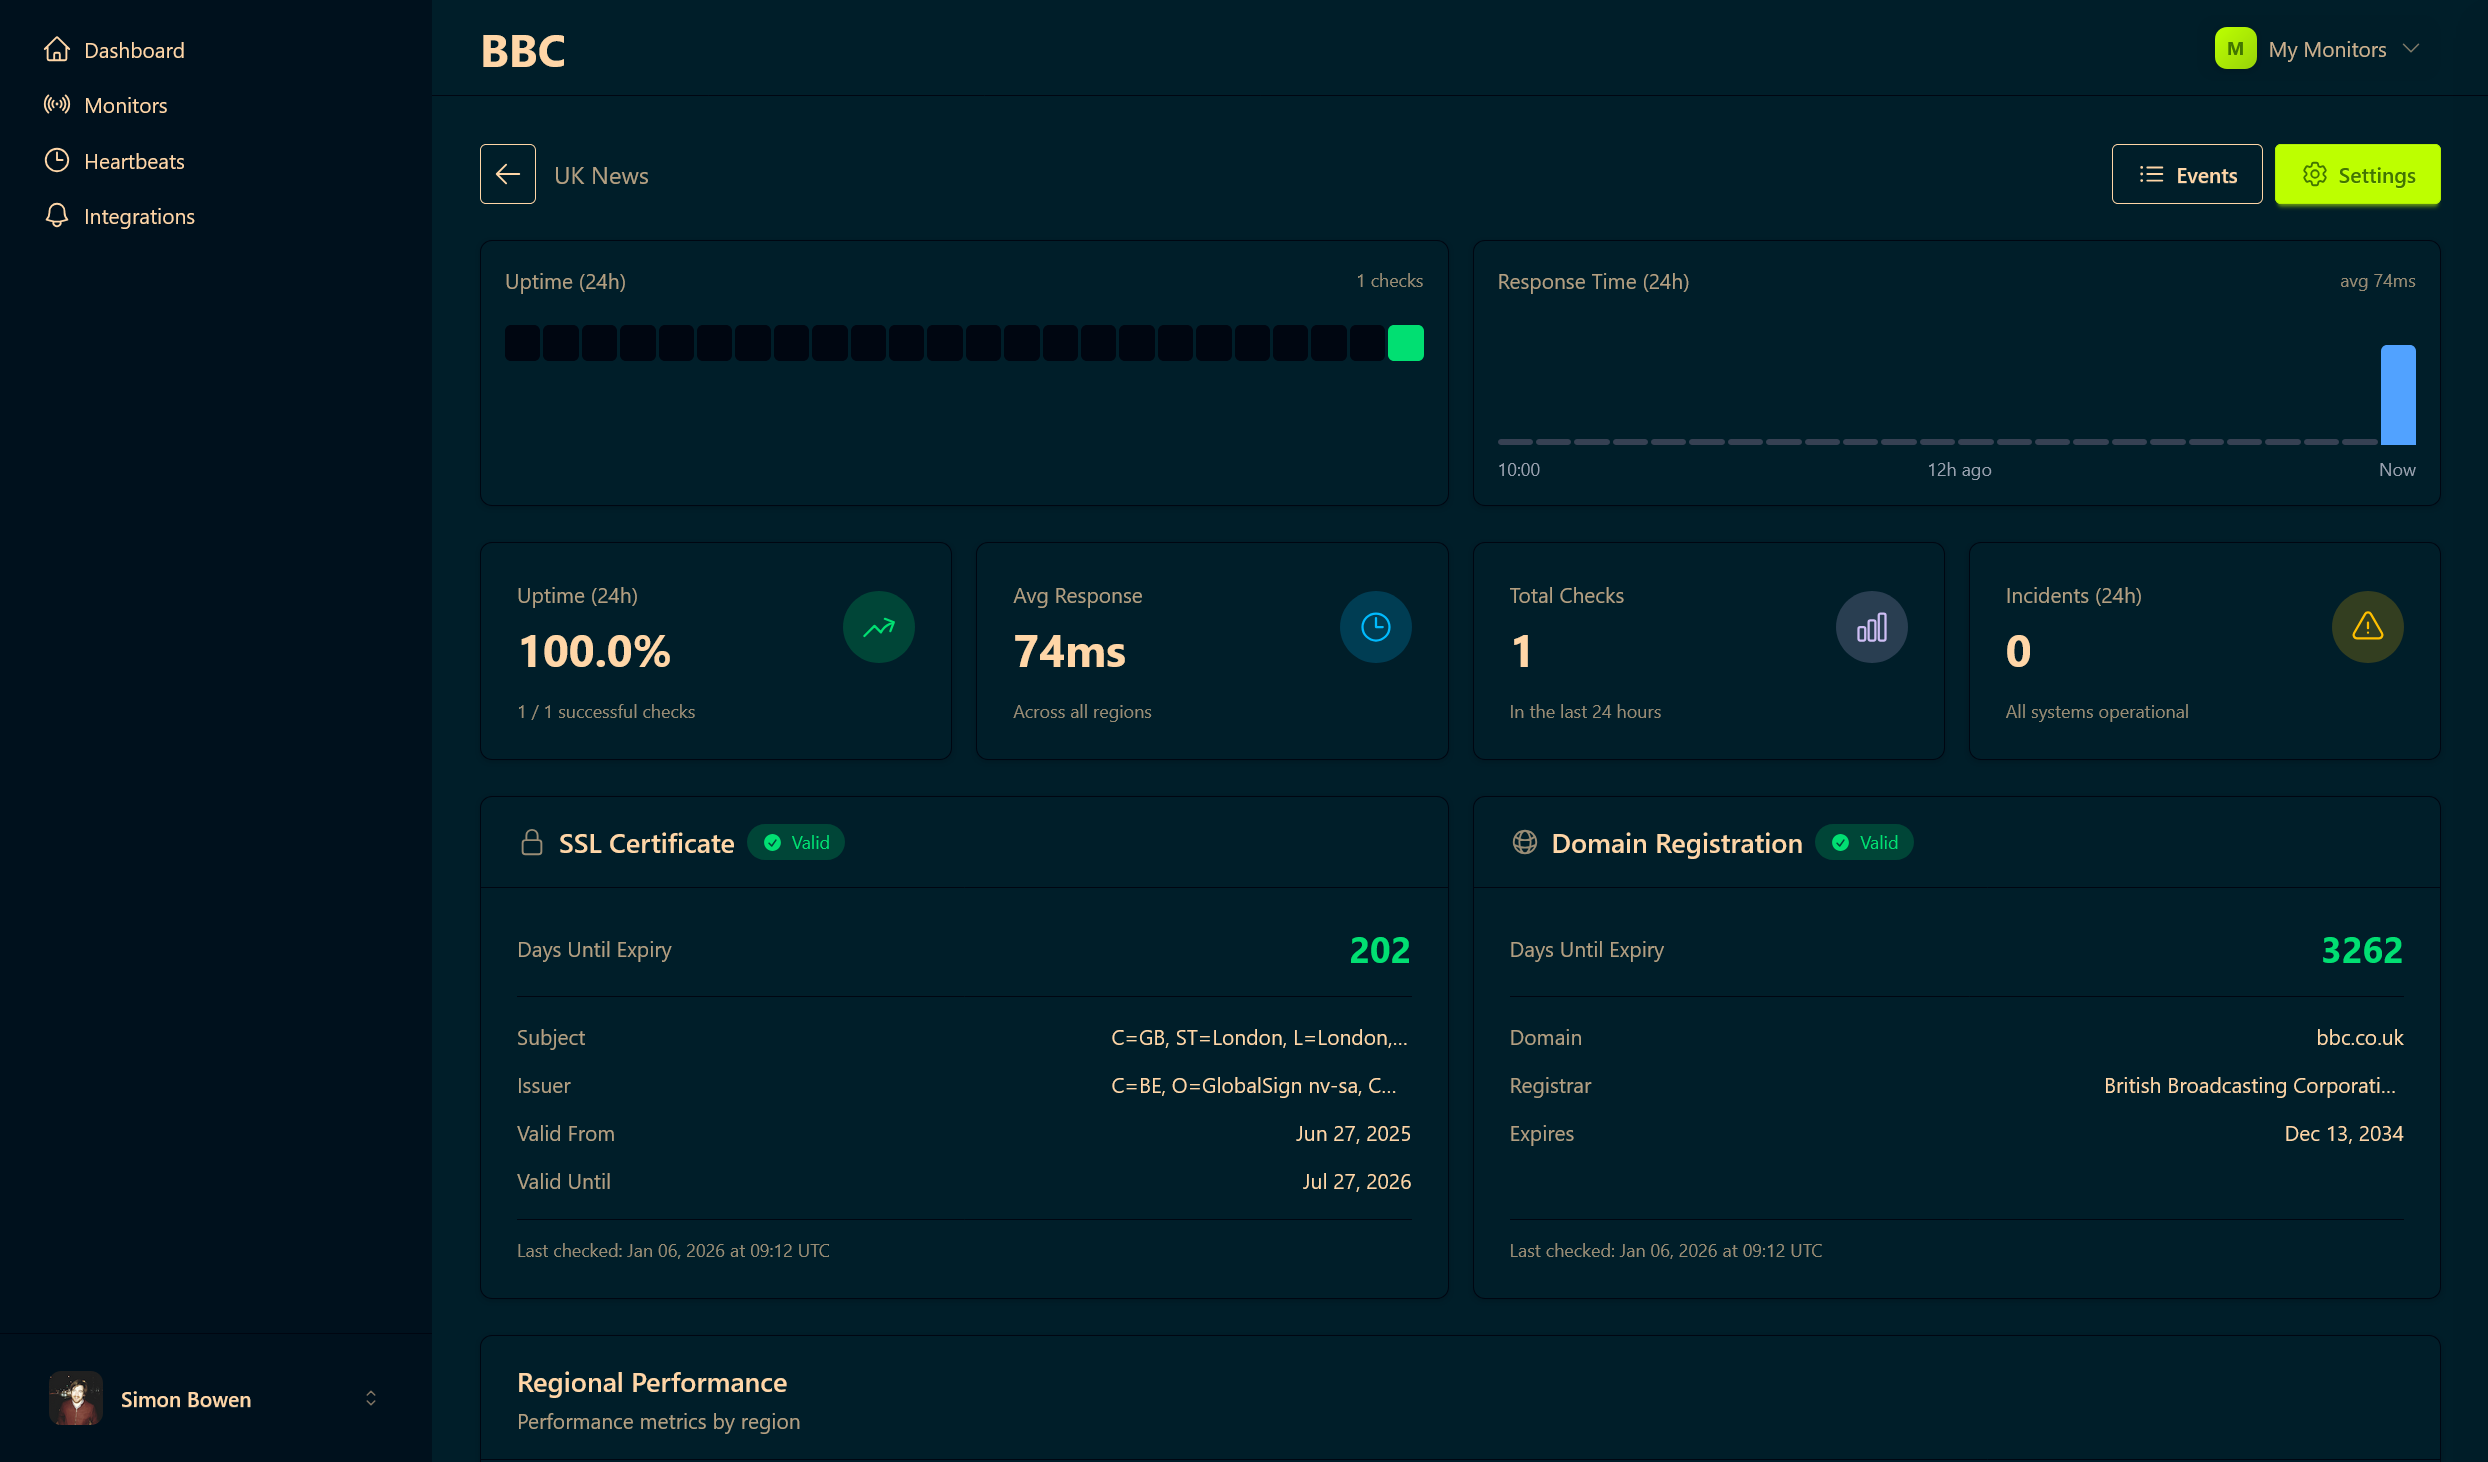
Deep insights for every monitor
See detailed performance metrics, response time graphs, and uptime statistics for each monitor. Track issues across regions.
Response time charts
Visualize performance trends over 24 hours
Regional breakdown
See per-region latency and availability
SSL & domain status
Certificate expiry and domain registration info
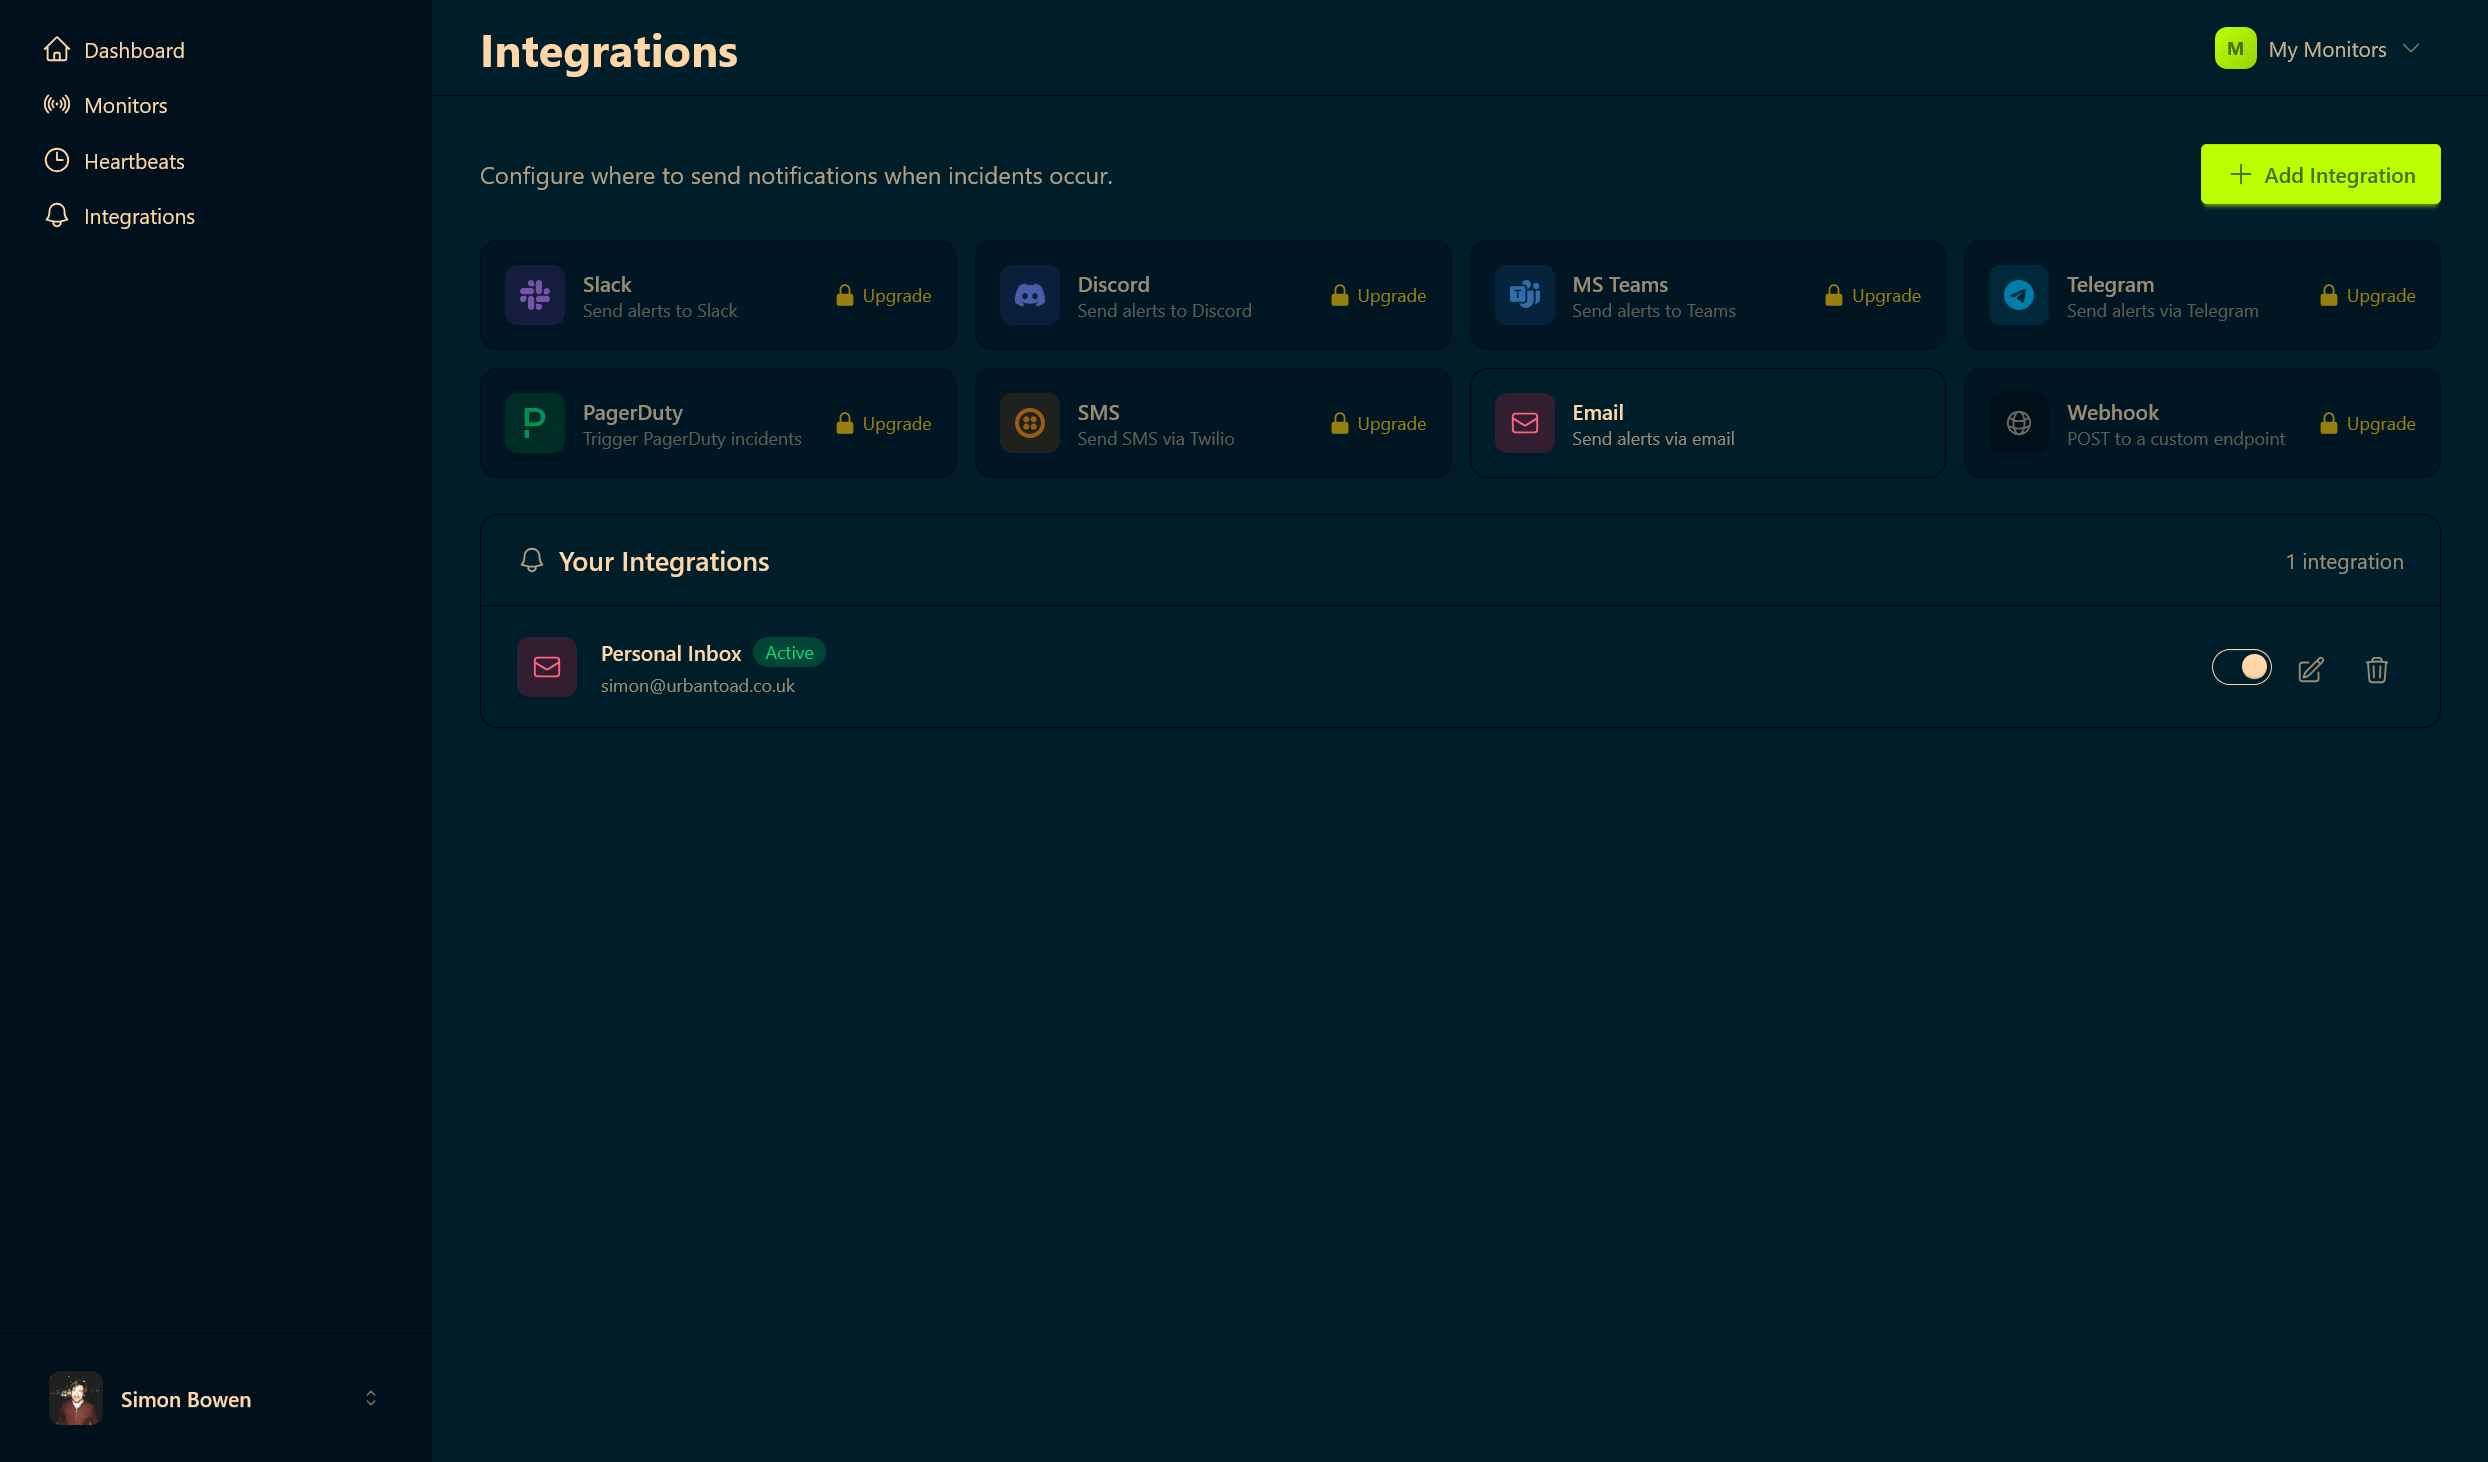
Alerts where you need them
Connect your favorite tools and get notified instantly when something goes wrong. From Slack to PagerDuty, we've got you covered.
8 notification channels
Slack, Discord, Teams, Telegram, and more
Per-monitor configuration
Different alerts for different monitors
Custom webhooks
Build your own integrations with our API
Monitor your cron jobs
Keep track of scheduled tasks, background jobs, and cron jobs. Get alerted when jobs fail to run, take too long, or error out.
Simple ping URLs
Just curl your unique URL from your job
Start/complete tracking
Monitor job duration and detect hung jobs
Grace periods
Allow for normal job timing variations
# Simple heartbeat
curl -fsS https://updog.ninja/ping/abc123

# With start/complete tracking
curl -fsS https://updog.ninja/ping/abc123/start
./my-backup-script.sh
curl -fsS https://updog.ninja/ping/abc123/complete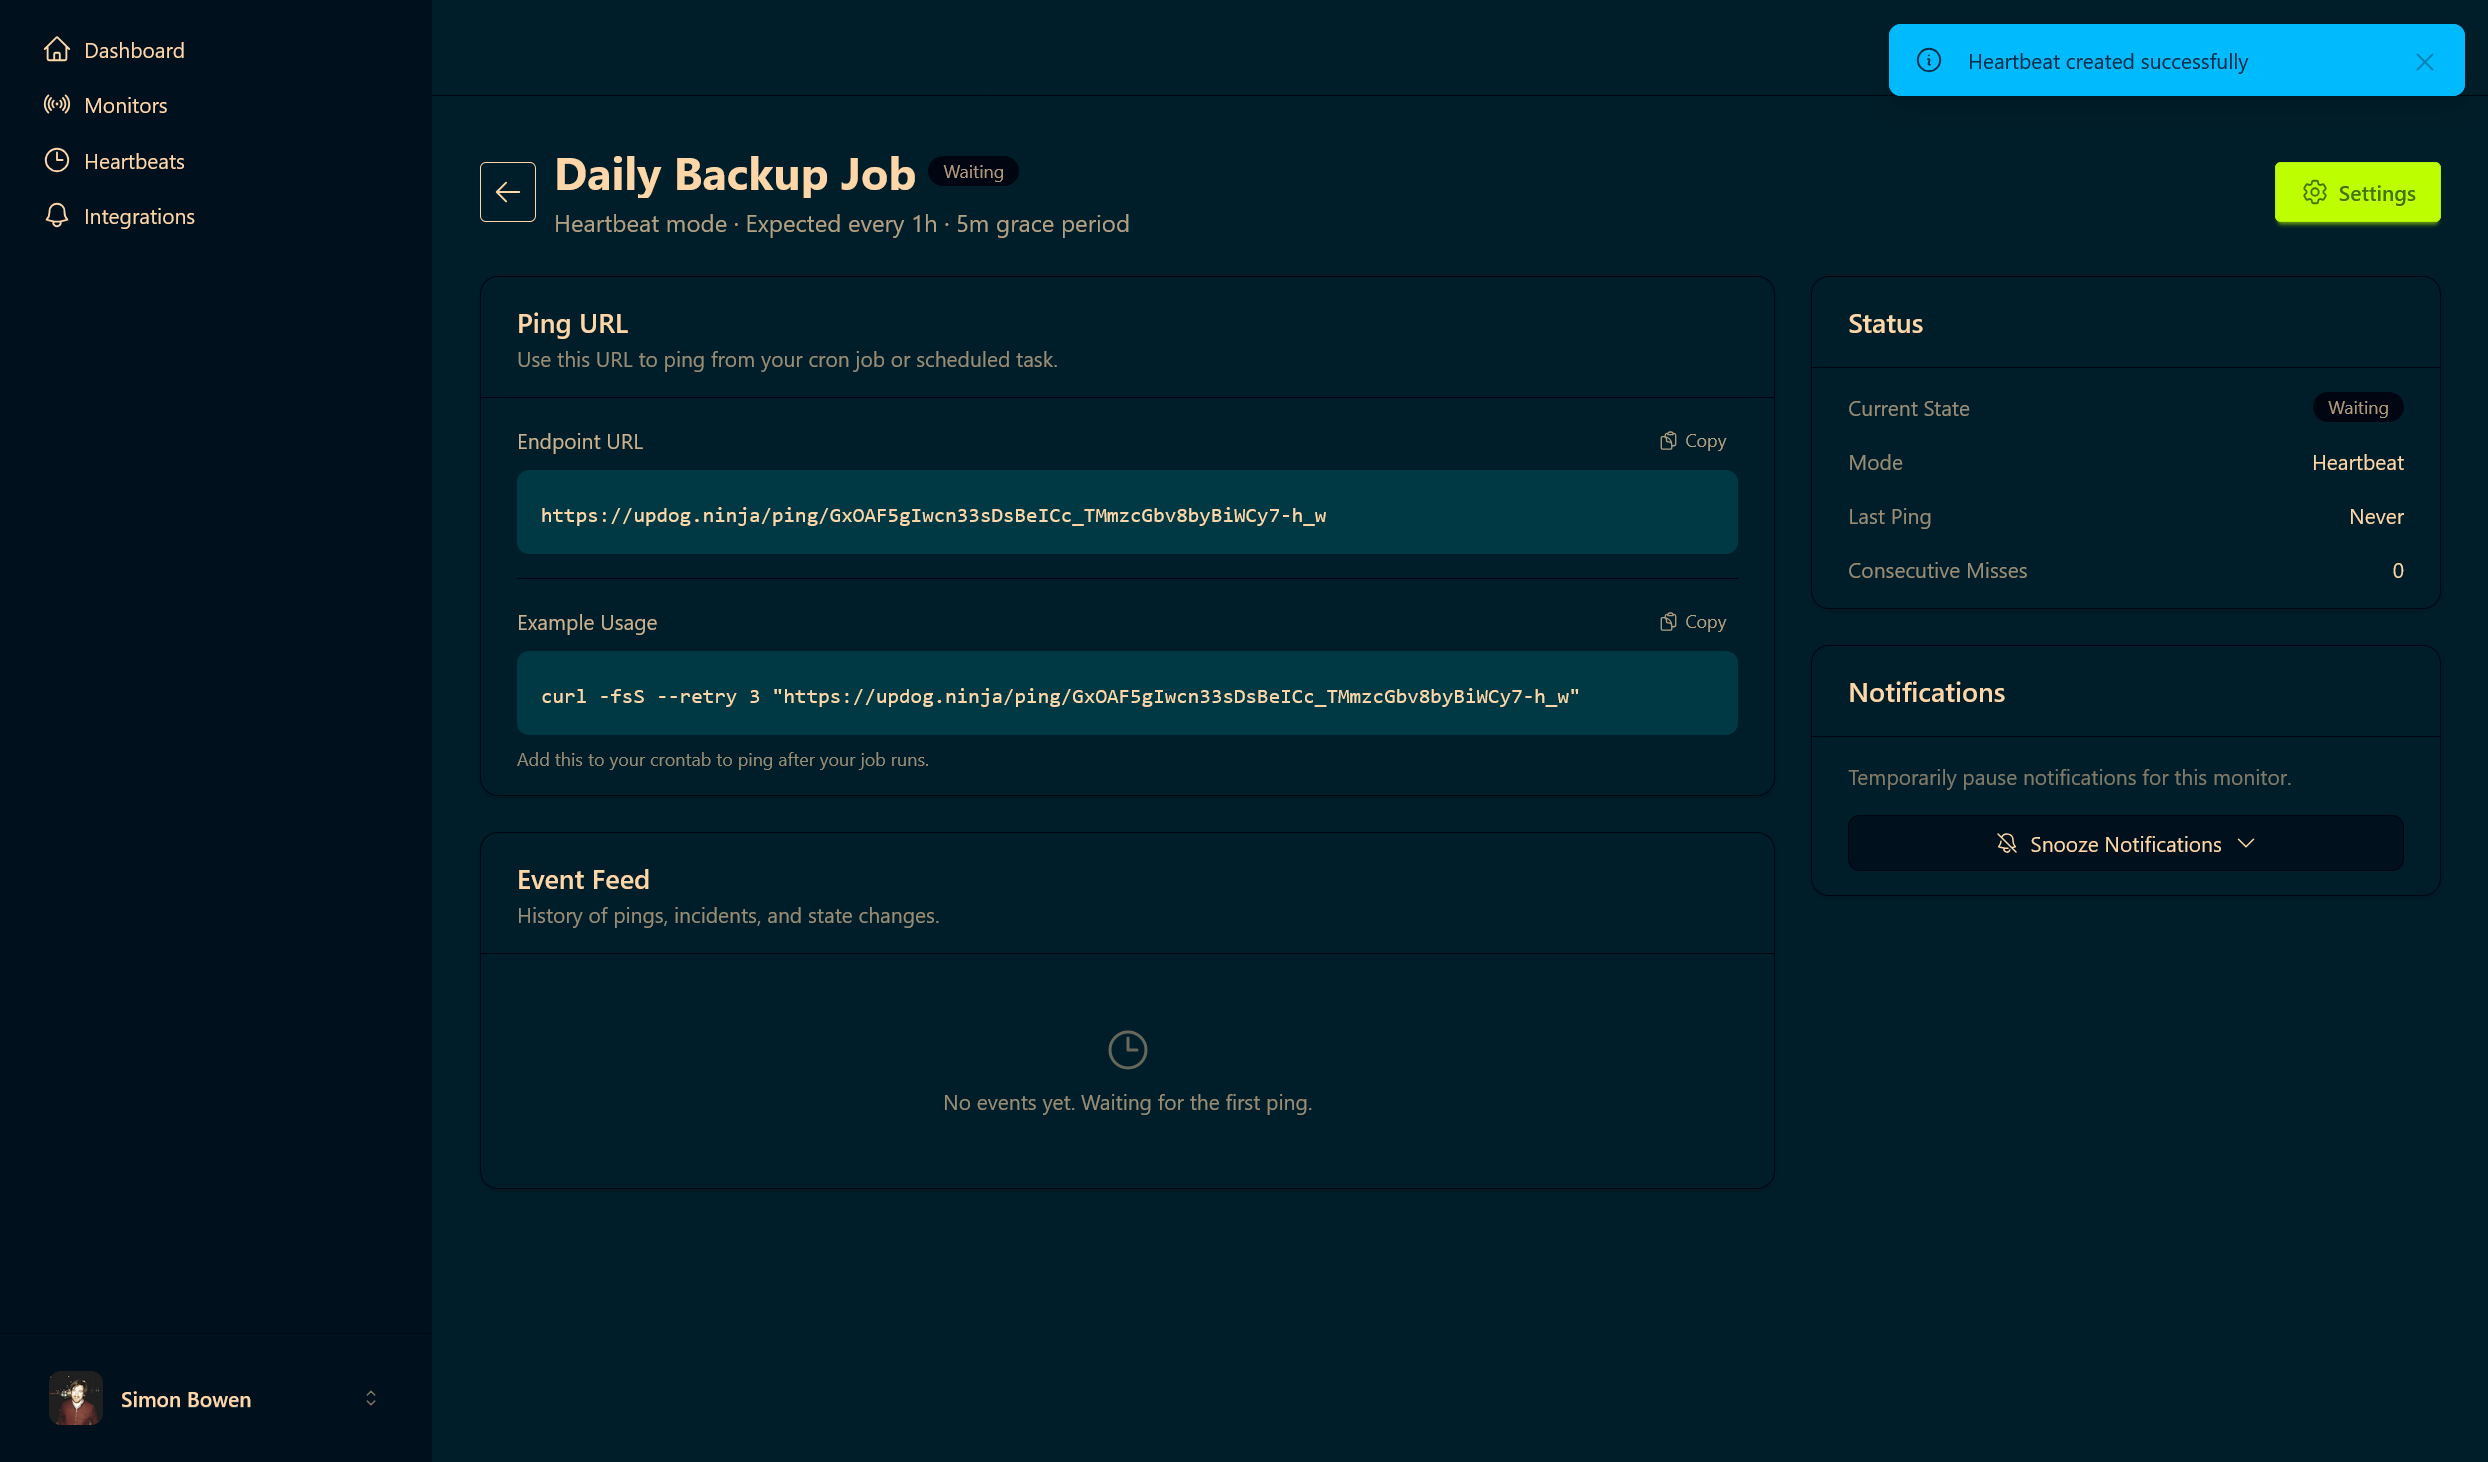
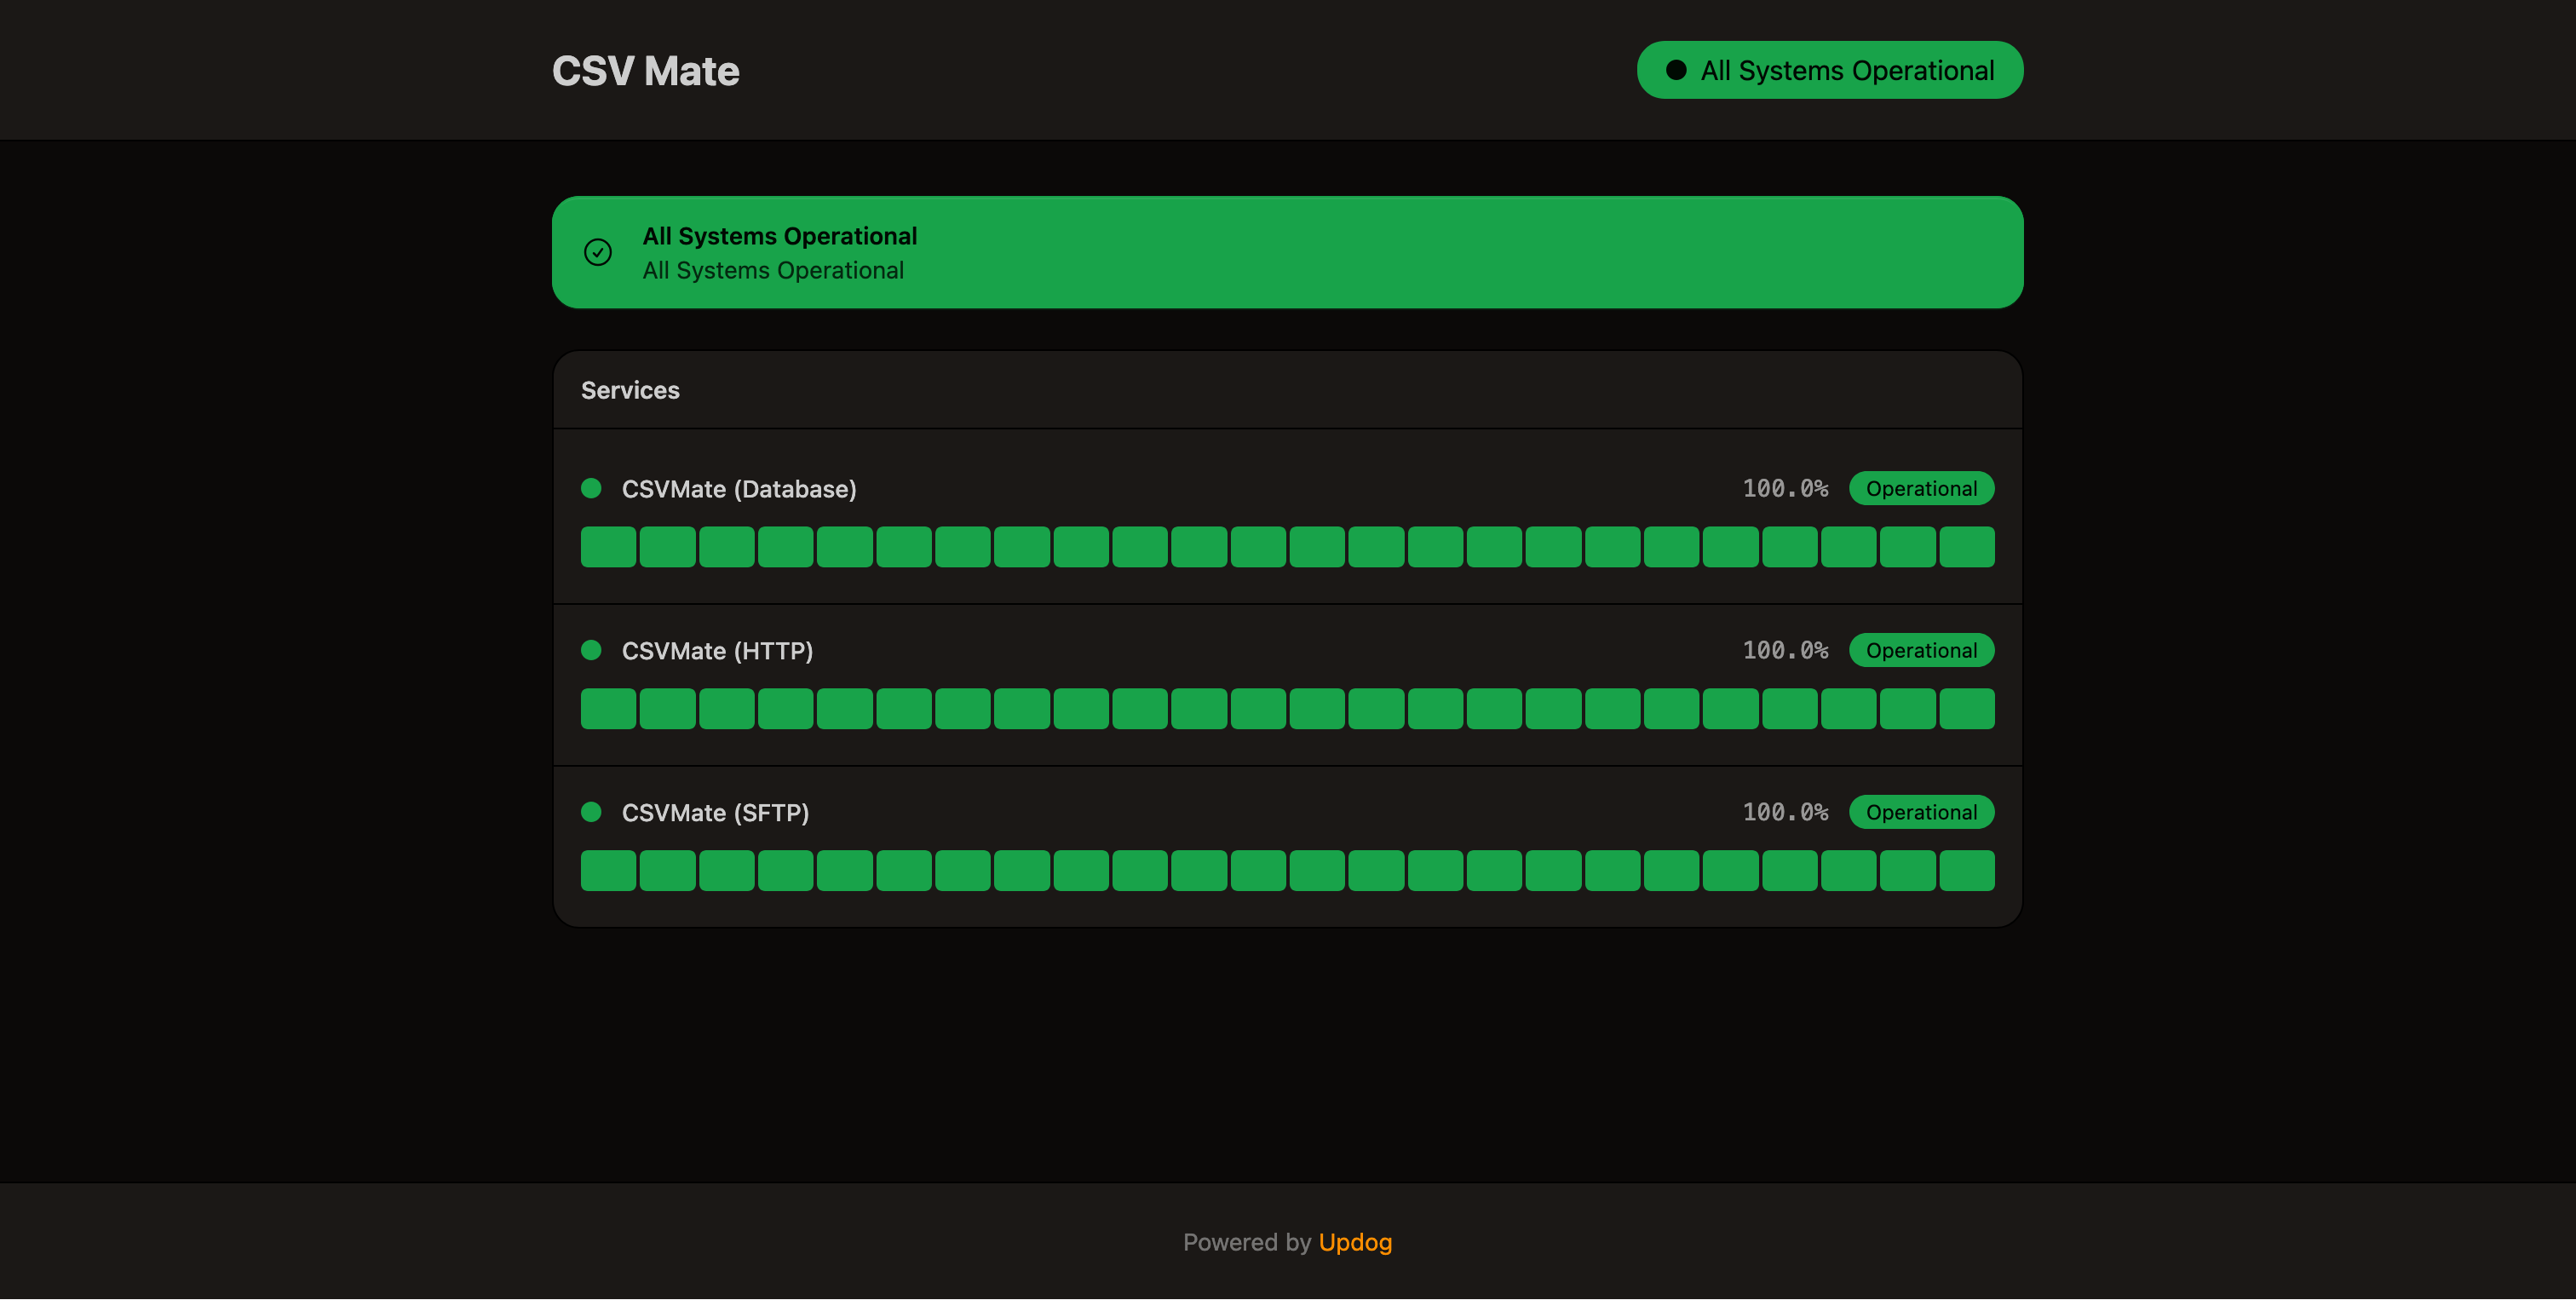
Beautiful status pages for your customers
Keep your customers informed with public status pages. Display real-time service status, incident history, and uptime metrics all in one place.
Real-time status updates
Automatically reflect monitor status changes instantly
90-day incident history
Show your track record with historical uptime data
Custom branding
Add your logo and brand colors for a seamless experience
Group multiple monitors
Organize services into categories for better clarity
Get started in minutes
Setting up monitoring for your websites is quick and easy
Create an account
Sign up with Google or GitHub. No credit card required to get started.
Add your monitors
Enter the URLs you want to monitor. Configure check intervals and alerting.
Stay informed
Get instant alerts when issues are detected. View status on your dashboard.
Built for reliability
Powered by battle-tested technology designed for high availability
Get in touch
Have questions? We'd love to hear from you.
Start monitoring your websites today
We can't find the internet
Attempting to reconnect
Something went wrong!
Attempting to reconnect